Experts predict $7,500 target as economic uncertainty, central bank buying, and geopolitical tensions drive unprecedented rally
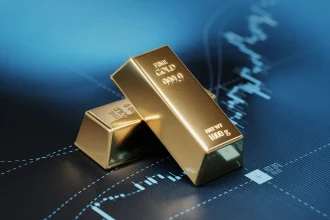
BREAKING NEWS — In a historic moment that sent shockwaves through global financial markets, gold shattered the psychological $5,000 per ounce barrier today, marking an extraordinary milestone in the precious metal’s 5,000-year history as the ultimate store of value. The yellow metal reached an intraday high of $5,047 per troy ounce at 10:23 AM EST, representing a staggering 85% gain from just three years ago and cementing gold’s position as one of 2026’s best-performing major assets.
- Experts predict $7,500 target as economic uncertainty, central bank buying, and geopolitical tensions drive unprecedented rally
- What Happened Today: Markets React to Historic Breakthrough
- Key Drivers Behind Gold’s Extraordinary Rally
- Historical Context: Parallels to Past Rallies
- Expert Perspectives: Bulls, Bears, and $7,500
- Future Scenarios: Three Paths Forward
- Investment Implications: Strategy at All-Time Highs
- Ripple Effects: How $5,000 Gold Reshapes Markets
- Conclusion: The New Era of Gold
This breathtaking ascent has vindicated gold bulls who warned that unprecedented monetary expansion, mounting geopolitical tensions, and structural shifts in the global monetary system would propel the precious metal to levels once dismissed as fantasy. The journey to $5,000 tells a story of accelerating gains: gold crossed $2,000 in August 2020, took fourteen months to reach $3,000, just ten months to hit $4,000, and only sixteen months to pierce $5,000 today.
For investors who allocated even modest portions to gold three years ago, the returns have been life-changing. A $50,000 investment at $2,700 in early 2023 now stands worth $92,500—an 85% gain that has outpaced the S&P 500, bonds, and most alternatives. Yet many analysts believe this rally has only reached its midpoint, with major institutions now forecasting gold at $7,500 to $10,000 within 18-24 months.
What Happened Today: Markets React to Historic Breakthrough
Trading volumes exploded as gold breached $5,000, with COMEX futures volume reaching 547,000 contracts—nearly triple the recent daily average. The SPDR Gold Shares ETF (GLD) saw $2.8 billion in inflows in morning trading alone, the largest daily influx since March 2020.
“This is a watershed moment,” declared Peter Grosskopf, CEO of Sprott Inc. “We’ve witnessed gold break through major barriers before, but $5,000 represents something different—a recognition that the monetary system as we’ve known it is fundamentally changing.”
The U.S. dollar index plunged 1.2% to 98.5, its lowest since 2021, while Treasury yields spiked 12 basis points. The S&P 500 initially fell 2.1% before recovering to close down 0.8%, with gold mining stocks surging 8.4% as measured by the GDX ETF.
Bitcoin rallied 3.2% initially but surrendered gains by close, highlighting ongoing debate about whether gold’s surge validates or undermines cryptocurrency’s “digital gold” thesis.
Key Drivers Behind Gold’s Extraordinary Rally
Monetary Policy and Negative Real Rates
The foundation of gold’s ascent rests on central bank policies creating historically favorable conditions for precious metals. Despite the Federal Reserve’s 4.75% benchmark rate, real interest rates adjusted for actual inflation remain near zero or negative—gold’s sweet spot for outperformance.
The Fed faces “fiscal dominance”—with U.S. debt exceeding $36 trillion and interest payments approaching $1.5 trillion annually, raising rates sufficiently to combat inflation risks triggering sovereign debt crisis. This constraint keeps real rates suppressed, making gold’s zero yield less disadvantageous.
European Central Bank struggles prove even more acute, with Eurozone inflation at 3.2% despite aggressive rate hikes. ECB President Lagarde acknowledged that structural drivers including energy transition costs and deglobalization may keep inflation above 2% for years, validating gold’s inflation-hedging role.
Central bank balance sheets remain bloated at unprecedented levels—the Fed holds $7.4 trillion, while ECB, Bank of Japan, and Bank of England collectively hold over $15 trillion. This monetary overhang creates persistent inflation pressures driving investors toward hard assets.
Geopolitical Powder Keg
The current environment presents the most dangerous security landscape since the Cold War. The Russia-Ukraine conflict shows no resolution after three years, with nuclear rhetoric reaching Cuban Missile Crisis levels. Gold surged $147 per ounce in March following reports of tactical nuclear weapons moving to Belarus.
U.S.-China tensions over Taiwan represent gold’s largest catalyst. Pentagon assessments suggest over 50% probability of Chinese military action within 3-5 years—a scenario that would send gold toward $7,000-$10,000 as investors flee to safety.
Middle East instability simmers with Iran’s nuclear program advancing. Israeli signals of readiness for military strikes could ignite regional war, disrupting oil supplies and creating perfect conditions for gold’s parabolic rise.
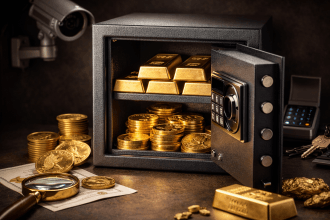
Central Bank Buying Reaches Historic Levels
Global monetary authorities purchased 1,037 tons in 2022, 1,081 tons in 2023, and are on pace for 1,150 tons in 2024—the highest sustained buying in modern history, completely reversing the 1990s-2000s when central banks were net sellers.
China’s People’s Bank leads, disclosing 316 tons purchased in 2023 with robust buying continuing. Analysts believe China’s actual purchases far exceed reported figures, potentially accumulating 500-700 additional tons through undisclosed channels. With $3.2 trillion in reserves, even modest rebalancing from dollars to gold creates enormous demand.
The motivation centers on “de-dollarization”—reducing dollar dependence after 2022’s freezing of Russia’s reserves. That unprecedented action proved even central bank reserves face potential seizure during geopolitical conflicts, spurring nations to increase gold as sanction-proof alternatives.
Turkey purchased 250 tons over 18 months despite currency chaos. India, Poland, Singapore, and numerous others disclosed significant purchases. World Gold Council data shows official sector demand now represents 25% of total global demand, up from 10% a decade ago—creating a firm floor under prices.
Dollar Weakness and Fiscal Concerns
The dollar index has fallen from 114 in September 2022 to 98.5 today—a 13.6% decline inversely correlating with gold’s surge. This reflects mounting concerns about America’s fiscal trajectory.
Federal debt reached $36.2 trillion, representing 123% of GDP—the highest peacetime ratio in history. Annual deficits exceed $2 trillion despite strong growth, with interest payments consuming $1.4 trillion annually, surpassing defense spending.
These dynamics create the “debt trap”—rising debt requiring ever-larger deficits to service obligations. Markets increasingly doubt Washington’s capacity for fiscal consolidation, leaving inflation as the most likely resolution—extraordinarily bullish for gold.
International dollar reserves declined from 72% in 2000 to 58% today, with acceleration post-2022. Even modest shifts from dollar reserves create enormous gold demand given the $12 trillion global reserve pool.
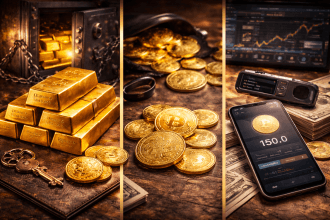
Investment Demand Surges
Gold-backed ETFs witnessed $47 billion in net inflows over twelve months. GLD’s assets surged from $53 billion to $89 billion, while IAU grew from $28 billion to $51 billion—representing thousands of tons pulled from markets.
Asian retail demand remains voracious. India imported 896 tons in 2023 despite record rupee prices. Chinese retail investors pivoted aggressively following property collapse, with Shanghai Gold Exchange withdrawals totaling 2,147 tons in 2023.
CFTC data shows hedge fund net long positions reaching 287,000 contracts—near 2020 highs, reflecting institutional recognition that macro conditions favor gold despite already sitting at all-time highs.
Technical Momentum
Gold’s breach of $5,000 triggered massive algorithmic buying. The breakout above $4,947 confirmed “higher high” patterns, attracting trend-following capital. A significant short squeeze saw speculators forced to cover as COMEX short interest declined from 78,000 to 51,000 contracts in two sessions.
Options market “gamma squeeze” effects added fuel as dealers selling call options bought futures to hedge exposure, creating feedback loops propelling gold through resistance.
Historical Context: Parallels to Past Rallies
The 1970s: From $35 to $850
The 1970s saw gold surge 2,329% from $35 to $850, driven by double-digit inflation, oil shocks, and collapsing fiat currency confidence. Today’s environment shares striking parallels, though key differences exist—1970s inflation peaked at 14.8% versus today’s 4%, while rates reached 20% versus 4.75%.
Adjusting 1980’s $850 peak for inflation yields $3,200 today—a level gold surpassed in 2022. This suggests either current conditions justify even higher real prices than 1980, or significant overvaluation has developed.
The 2008-2011 Rally
Gold’s 171% gain from $700 to $1,900 during 2008-2011 was driven by unprecedented QE and zero rates. Today’s catalysts show greater magnitude—post-COVID monetary expansion dwarfed 2008-2009 responses, while geopolitical tensions exceed anything in that period.
One concerning aspect involves accelerating pace between thousand-dollar milestones—14 months from $2,000 to $3,000, but only 10 months from $3,000 to $4,000. This acceleration often characterizes late-stage bull markets dominated by FOMO.
Expert Perspectives: Bulls, Bears, and $7,500
The Bullish Case
Goldman Sachs recently updated its target to $6,500, noting prices could reach $7,500 “if geopolitical risks escalate materially or fiscal concerns intensify.” Jeffrey Christian of CPM Group argues gold could reach $8,000-$10,000 within 18-24 months, stating “we’re witnessing a structural shift in global monetary order that occurs perhaps once per century.”
Independent researcher Luke Gromen presents even more aggressive projections, envisioning eventual yield curve control forcing the Fed to cap long-term rates, creating explicit financial repression sending gold to $12,000-$15,000.
Technical analyst Ralph Acampora suggests $6,000 by mid-2026 based on chart patterns and momentum. “We’re seeing classic bull market signs—higher highs, higher lows, expanding volume on rallies.”
The Skeptical View
JP Morgan cautions gold appears “overextended near-term, trading 8% above fundamental fair value,” suggesting pullback to $4,300-$4,500 over 3-6 months. David Rosenberg warns that 84% bulls versus 9% bears represents sentiment extremes historically preceding corrections.
Charlie Morris of ByteTree notes gold trades at 3.6 times production costs—the highest since 2011 when gold subsequently corrected 45%. Some question whether the rally can sustain without significant U.S. retail participation, which remains modest.
Future Scenarios: Three Paths Forward
Bull Case: $7,000-$10,000
The aggressive scenario envisions $7,000-$10,000 by late 2027, requiring catastrophic catalysts: Taiwan military conflict, U.S. fiscal crisis forcing yield curve control, major banking failures, currency collapse, or inflation resurgence forcing Fed to restart QE.
For $10,000 gold, real rates would need to turn deeply negative (below -3%), the dollar decline another 15-20%, and investment demand surge dramatically beyond current levels.
Base Case: $5,500-$6,500
The moderate scenario projects consolidation before gradually advancing to $5,500-$6,500 over 12-18 months, assuming current drivers persist without escalation. Gold might pull back 5-8% to $4,600-$4,750 over 1-3 months, establish a trading range, then resume upward trajectory in H2 2026.
This suggests annual 10-15% returns—solid performance outpacing bonds and cash but more modest than recent explosive gains.
Bear Case: $4,000-$4,500
The bearish scenario envisions 15-20% correction over 3-6 months, requiring Fed maintaining higher rates longer, stronger economic growth, geopolitical de-escalation, technical breakdown, or profit-taking cascade.
Even bears acknowledge major support exists from central bank buying. Few envision trading below $3,500 absent complete fundamental reversal.
Investment Implications: Strategy at All-Time Highs
The Case for Continued Accumulation
History suggests major bull markets continue far longer than seems rational. Gold’s 1970s rally saw numerous “overbought” moments at $100, $200, $400 before reaching $850. Dollar-cost averaging likely delivers positive returns if structural thesis proves correct.
The key recognition: gold functions as portfolio insurance, not speculative growth. Allocating 5-15% at $5,000 makes sense if you believe insurance is necessary, just as homeowner’s insurance makes sense regardless of premium levels.
Risk Management
New investors should start with modest 3-5% allocations, allowing increases during pullbacks without immediate losses. Existing holders face decisions about taking profits versus maintaining exposure, considering tax implications.
Rebalancing discipline suggests trimming positions grown beyond targets. If gold rose from 7% to 14% of portfolio, selling half locks gains while maintaining meaningful exposure.
Alternatives Worth Considering
Gold mining stocks offer 2-3x leveraged exposure through operational leverage where rising gold flows directly to earnings. The GDX ETF provides diversified sector exposure, though mining stocks carry company-specific risks and broader equity correlation.
Silver presents an intriguing alternative given extreme underperformance. The 94:1 gold-to-silver ratio sits well above 60:1 long-term average, suggesting silver could significantly outperform during catch-up. However, silver’s industrial exposure creates different characteristics.
Ripple Effects: How $5,000 Gold Reshapes Markets
Gold Mining Stocks Surge
Major miners rallied 47% over the past year as $5,000 gold dramatically improves economics. At current prices, even high-cost producers generate enormous profits, expanding margins and driving consolidation.
Silver Awakens
Silver rallied from $22 to $28 over six weeks. Analysts suggest gold-silver ratio compression has only begun, with potential for $40-$50 silver if gold continues higher—moves dramatically outperforming gold percentage-wise.
Bitcoin’s Identity Crisis
Bitcoin’s muted response raises questions about “digital gold” narrative. While some argue both rise as fiat alternatives, Bitcoin’s correlation with tech stocks suggests it functions more as speculative growth investment than inflation hedge.
Currency Markets
The dollar’s decline accelerated, with DXY at 98.5—levels unseen since 2021. Traditional safe-havens like Swiss Franc and Yen strengthened. Emerging market currencies show complex dynamics, with resource-rich currencies strengthening while deficit nations face pressure.
Fixed Income Stress
Treasury markets show strain as gold’s rally undermines confidence in dollar-denominated bonds. The 10-year yield rose to 4.62% despite gold’s surge—typically, safe-haven flows push yields lower. The divergence suggests investors question long-term bond value.
Commodities Awakening
Gold’s strength lifts other commodities, with crude above $82, copper and aluminum up 12-18%. The Bloomberg Commodity Index rose 17% over six months, supporting interpretation that tangible assets are repricing higher relative to paper claims.
Conclusion: The New Era of Gold
Gold’s breakthrough above $5,000 signals a fundamental shift in how investors perceive value and risk. This is not merely cyclical but potentially a structural bull market driven by forces more powerful than typical economic cycles—unprecedented fiscal deficits, negative real rates, geopolitical fragmentation, central bank diversification, and eroding fiat confidence.
The 1970s parallel grows more relevant, suggesting we may be in early-to-middle stages of a rally carrying gold far higher. Yet markets don’t move in straight lines. Gold holders should prepare for potential 10-20% pullbacks testing conviction before the next leg materializes.
For those who missed the rise from $1,800, recognize that underlying drivers show no resolution signs. If the structural thesis is correct, gold at $5,000 may prove as attractive as $1,800 was in retrospect.
The most prudent approach involves maintaining exposure appropriate to circumstances—5-15% for most investors, higher for those deeply concerned about currency depreciation or geopolitical catastrophe. Balance conviction about gold’s long-term role with humility about short-term predictions.
The $5,000 barrier’s breach changes the conversation. Gold has transformed from “alternative investment” to potential portfolio necessity as the monetary order shows widening cracks. Welcome to the new era where yesterday’s fantasy prices become today’s reality, and tomorrow’s targets require expanding our sense of what’s possible.