

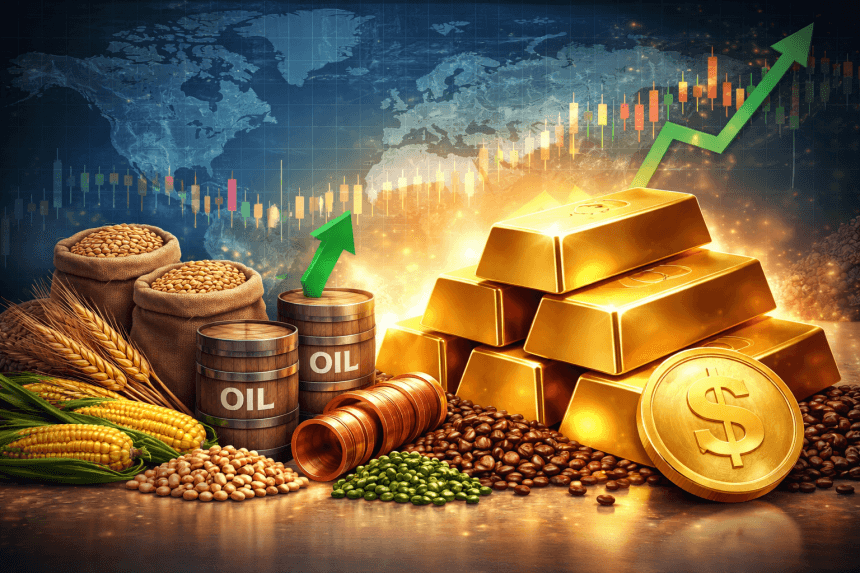
The world of tangible assets extends far beyond gold’s gleaming allure to encompass a vast universe of physical commodities—from the crude oil powering global transportation to the copper wiring modern civilization, from the wheat feeding billions to the lithium enabling electric vehicle revolution. Understanding how these diverse commodities compare to gold and interact with each other unlocks powerful diversification strategies that can enhance portfolio resilience, generate returns across varied economic environments, and provide comprehensive inflation protection.
This comprehensive guide examines major commodity categories and their characteristics relative to gold, explores historical supercycles that drive extraordinary returns during certain decades, analyzes correlation patterns across different economic phases, provides frameworks for constructing diversified commodity portfolios, and explains practical implementation through ETFs and commodity indices.
Major Commodities Compared to Gold
Commodities span multiple categories—energy, industrial metals, precious metals, and agriculture—each with distinct supply-demand dynamics, economic drivers, and investment characteristics that differ substantially from gold’s monetary metal profile.
Crude Oil: The World’s Most Important Commodity
Crude oil represents the backbone of modern industrial civilization, with daily global consumption exceeding 100 million barrels powering transportation, manufacturing, petrochemical production, and electricity generation. Oil’s critical economic role creates characteristics fundamentally different from gold.
Supply dynamics: Oil supply depends on geology, geopolitics, and OPEC+ production decisions. The cartel’s capacity to curtail supply creates artificial scarcity supporting prices, though effectiveness varies based on member discipline and non-OPEC production growth. U.S. shale revolution dramatically altered supply dynamics, with American production rising from 5 million to 13 million barrels daily between 2008-2023, weakening OPEC’s control.
Demand drivers: Economic growth directly correlates with oil consumption. Recessions reduce transportation and manufacturing activity, collapsing demand and prices. Expansions increase energy needs, supporting higher prices. This strong cyclicality contrasts sharply with gold’s counter-cyclical safe-haven properties.
Price volatility: Oil exhibits extreme volatility, with prices ranging from negative $37 during April 2020’s storage crisis to $147 in 2008. This volatility dwarfs gold’s 15-20% annual fluctuations, creating both opportunity and risk.
Historical performance: From 2000-2025, oil delivered approximately 5% annualized returns with massive drawdowns exceeding 70% during 2008 and 2020 crashes. Gold returned 8% annually with maximum 45% drawdown, demonstrating superior risk-adjusted performance despite oil’s higher beta during bull markets.
Inflation relationship: Oil drives inflation rather than simply responding to it. Energy price surges propagate through economies via transportation costs, manufacturing inputs, and electricity prices. Gold benefits from inflation but doesn’t cause it, creating different portfolio roles.
Storage and contango: Unlike gold, oil requires expensive storage (tanks, pipelines, ships). Futures markets frequently trade in contango (future prices exceeding spot), creating negative roll yield that erodes returns for futures-based oil investments. Gold storage costs remain modest and futures typically trade near spot.
Copper: The Metal with a PhD in Economics
Copper’s ubiquitous industrial applications—electrical wiring, construction, manufacturing, electronics—make it a sensitive economic indicator earning the nickname “Dr. Copper” for its supposed predictive power regarding global growth.
Economic sensitivity: Copper demand correlates strongly with GDP growth, particularly in manufacturing-heavy economies like China consuming 50% of global supply. Recessions devastate copper demand as construction and manufacturing collapse. Gold inversely benefits from economic uncertainty.
Supply constraints: Major copper mines require decade-long development timelines and massive capital investments. This supply inelasticity means demand surges cannot be quickly met, causing explosive price rallies. Current underinvestment in new mines suggests potential supply shortfalls supporting future prices.
Electrification megatrend: Electric vehicles contain 4x more copper than internal combustion vehicles. Renewable energy infrastructure demands massive copper quantities. The energy transition creates structural demand growth potentially overwhelming supply, driving multi-year bull markets.
Price performance: Copper delivered 7% annualized returns from 2000-2025, with violent cycles ranging from $0.60/lb to $5.00/lb. Gold’s smoother appreciation contrasts with copper’s boom-bust cyclicality reflecting economic swings.
China dependency: Chinese construction and infrastructure investment drives global copper demand. China’s economic slowdowns devastate prices regardless of conditions elsewhere. Gold’s demand base proves more geographically diversified.
Carry costs: Physical copper requires warehouse storage and insurance. Industrial consumers can more easily substitute alternatives during price spikes, limiting upside compared to monetary metals without industrial substitutes.
Agricultural Commodities: Wheat as Representative
Agricultural commodities including wheat, corn, soybeans, coffee, sugar, and cotton represent consumable goods with unique characteristics differing from both metals and energy.
Weather dependency: Crop yields depend heavily on weather patterns during critical growing seasons. Droughts, floods, extreme temperatures, or pest infestations can devastate harvests, causing supply shocks driving explosive price rallies. Gold faces no comparable production uncertainty.
Seasonal patterns: Agricultural commodities exhibit strong seasonal price patterns reflecting planting, growing, and harvest cycles. Prices typically peak during growing season supply uncertainty and bottom post-harvest when supply becomes known. Gold shows minimal seasonality.
Perishability and storage limits: Unlike durable metals, agricultural products deteriorate over time. Storage capacity constraints mean bumper crops cannot simply accumulate indefinitely, forcing prices down until consumption clears excess supply. This creates more volatile price discovery than durable commodities.
Government intervention: Agricultural policy significantly impacts prices through subsidies, acreage restrictions, trade policies, and strategic reserves. The U.S., EU, China, and other major agricultural powers regularly intervene in markets pursuing food security and political objectives. Gold markets face less direct government manipulation.
Demand stability: Food demand remains relatively stable regardless of economic conditions—people eat during recessions and booms. However, demand composition shifts toward staples during hardship and toward premium products during prosperity. This stability contrasts with cyclical industrial commodities.
Long-term returns: Wheat returned approximately 3% annualized from 2000-2025, underperforming most commodities and gold. However, grain markets witnessed extraordinary spikes during 2008 (+130%) and 2022 (+60%) food crises that delivered spectacular short-term gains for positioned traders.
Inflation hedge effectiveness: Agricultural commodities provide less reliable long-term inflation hedging than gold due to productivity improvements and technological advances continuously reducing real production costs. Short-term supply shocks create spikes, but secular trends show real agricultural prices declining over decades.
Comparative Return Profiles (2000-2025)
Annualized total returns across major commodities reveal diverse performance:
- Gold: 8.2% (strongest performer with lowest volatility)
- Silver: 7.1% (high volatility, strong bull markets, devastating bear markets)
- Crude Oil: 4.8% (extreme volatility, massive drawdowns)
- Copper: 6.9% (cyclical, China-dependent)
- Natural Gas: 2.1% (highest volatility, frequent boom-bust cycles)
- Wheat: 2.8% (stable with episodic spikes)
- Bloomberg Commodity Index: 4.3% (diversified basket)
Risk-adjusted returns (Sharpe ratios) favor gold and diversified commodity indices over individual commodities, demonstrating diversification benefits and gold’s superior risk-return characteristics.
Commodity Supercycles: Decades of Boom and Bust
Commodity markets exhibit long-duration cycles spanning 15-30 years, alternating between extended bull markets and secular bear markets driven by investment waves in productive capacity and demand shifts.
The Supercycle Framework
Commodity supercycles follow predictable patterns:
Phase 1 – Bear Market Bottom (5-8 years): Low prices discourage investment in new supply capacity. Mines close, exploration stops, capital flees sector. Existing production depletes without replacement. Demand slowly recovers from previous bust.
Phase 2 – Early Bull Market (3-5 years): Demand growth exceeds supply as economic expansion accelerates. Prices begin rising but remain below replacement costs. Initial price increases dismissed as temporary by industry suffering bear market psychology.
Phase 3 – Full Bull Market (5-10 years): Prices surge above replacement costs, triggering massive investment wave. However, long development timelines mean new supply arrives years late. Supply deficit intensifies, driving parabolic price increases. Media coverage proliferates, retail investors pour capital into commodities.
Phase 4 – Peak and Reversal (1-3 years): Massive new supply commissioned during high prices begins production simultaneously. Demand slows from economic cycles or demand destruction from high prices. Market transitions from deficit to surplus. Prices collapse, stranding capital in uneconomic projects.
Historical Supercycles
1970s Energy/Metals Boom: OPEC oil embargo, peak oil fears, and industrial demand from post-war development drove oil from $3 to $40 (1973-1980), copper from $0.50 to $1.40, and gold from $35 to $850. Inflation compounded gains.
1980-1999 Bear Market: Demand destruction from early-1980s recession, non-OPEC oil production growth, technology reducing materials intensity, and China’s dormant economy created 20-year commodity bear market. Real prices declined 50-70% across most categories.
2000-2011 China Supercycle: Chinese industrialization and infrastructure build-out created insatiable commodity demand. Oil surged from $20 to $147, copper from $0.60 to $4.50, iron ore from $10 to $190. Even agricultural commodities participated as Chinese dietary improvements increased meat consumption.
2011-2020 Bust and Stagnation: China’s growth model transition from investment to consumption, massive oversupply from capacity additions, and shale revolution collapsing oil prices created broad commodity bear market. Most commodities declined 50-70% from peaks.
2020-Present: Energy Transition Cycle? Underinvestment during 2011-2020 bear market, pandemic disruptions, Ukraine war, and clean energy transition create potential new supercycle. However, demand concerns around China and recession risks create uncertainty about whether genuine supercycle has commenced.
Current Cycle Position Assessment
Determining current position within supercycle proves crucial for allocation decisions. Evidence suggests early stages of potential new cycle:
Supply indicators: Years of underinvestment in mines, wells, and processing capacity. Major oil companies shifted capital from exploration to shareholder returns. Copper mine development pipeline insufficient for projected demand. These suggest supply tightness ahead.
Demand indicators: Energy transition requires massive commodity quantities—lithium, copper, nickel, cobalt for batteries; steel and concrete for renewables infrastructure. If genuine transition occurs, demand could exceed most forecasts.
Price indicators: Real commodity prices remain below previous cycle peaks, suggesting room for appreciation if supercycle develops. However, prices have rebounded from 2020 lows, meaning not at cycle bottoms.
Sentiment indicators: Commodity funds remain under-allocated compared to 2000s when sector attracted enormous capital. Institutional investors show renewed interest but haven’t committed to large overweights. Retail investor awareness remains low.
Conclusion: Likely in early-to-middle stages of potential supercycle, though recession risks and China demand concerns create uncertainty. Historical parallel: 2003-2004 during previous supercycle’s early phase before explosive 2005-2008 rally.
Correlations Across Economic Phases
Commodity-gold correlations vary dramatically depending on economic conditions, making phase identification crucial for portfolio positioning.
Expansion Phase: Commodities Outperform
During economic expansions featuring strong GDP growth, rising manufacturing activity, and increasing energy consumption, industrial commodities significantly outperform gold.
Correlation dynamics: Commodities show positive correlation with stocks (0.4-0.6) as both benefit from growth. Gold shows near-zero or negative correlation with stocks, lagging during risk-on environments.
Performance patterns: Copper, oil, industrial metals rally strongly as demand growth exceeds supply. Gold appreciates modestly or stagnates as positive real interest rates and risk appetite reduce safe-haven demand.
Example periods:
- 2003-2007: Commodities +120%, Gold +95%, S&P 500 +95%
- 2016-2018: Commodities +25%, Gold +8%, S&P 500 +50%
Portfolio implications: Overweight industrial commodities and energy, maintain baseline gold allocation for diversification but avoid overweight.
Recession Phase: Gold’s Safe-Haven Advantage
Economic contractions create demand destruction for industrial commodities while strengthening gold’s safe-haven appeal.
Correlation dynamics: Commodities show strong positive correlation with stocks during recessions (0.5-0.7) as both decline together. Gold shows negative correlation (-0.3 to -0.5), often rallying as stocks fall.
Performance patterns: Industrial commodity prices collapse 30-60% during severe recessions. Energy follows. Agricultural commodities show resilience but rarely rally strongly. Gold often appreciates 10-30% as safe-haven flows intensify.
Example periods:
- 2008-2009: Commodities -55%, Gold +25%, S&P 500 -48%
- 2020 Q1: Commodities -38%, Gold +8%, S&P 500 -20%
Portfolio implications: Overweight gold substantially, reduce or eliminate industrial commodity exposure, consider counter-cyclical commodities (some agricultural).
Inflation Shock Phase: All Commodities Rally
Supply shocks, currency debasement, or policy errors creating inflation surges drive broad commodity rallies including gold.
Correlation dynamics: All commodities show positive correlation as inflation affects everything. Gold-commodity correlation increases to 0.6-0.8 from typical 0.3-0.4.
Performance patterns: Energy and agricultural commodities often lead as supply shocks frequently originate in these sectors. Metals follow as inflation expectations spread. Gold rallies on monetary debasement fears.
Example periods:
- 1973-1974 Oil Crisis: Oil +300%, Wheat +200%, Gold +140%
- 2021-2022 Inflation Surge: Energy +80%, Agricultural +45%, Gold +8% (initially, then rallied strongly)
Portfolio implications: Diversified commodity exposure across categories, significant gold allocation, minimal bonds due to negative real yields.
Stagflation Phase: Gold and Energy Dominate
Rare but devastating economic environment combining stagnant growth with persistent inflation favors gold and energy over other commodities.
Correlation dynamics: Gold and oil show strong positive correlation (0.7+). Industrial metals weaken from demand destruction despite inflation. Agricultural shows mixed performance.
Performance patterns: Gold and energy rally strongly. Industrial commodities struggle as economic weakness offsets inflation. Result: divergence within commodity complex.
Example period:
- 1970s Stagflation Decade: Gold +2,330%, Oil +1,233%, Copper +160%, Wheat +190%
Portfolio implications: Heavy gold and energy overweight, reduce industrial metal exposure despite commodity bull market, selective agricultural positions.
Current Environment Classification (2026)
Present conditions show characteristics of multiple phases simultaneously:
- Inflation moderating but above target (slight inflation shock remnants)
- Economic growth slowing but avoiding recession (late expansion)
- Geopolitical tensions (supports gold safe-haven)
- Energy transition creating demand (supports industrial metals)
Verdict: Transitional environment favoring balanced commodity-gold approach with tilts toward gold (geopolitical insurance) and energy transition metals (structural demand).
Building a Diversified Commodity Portfolio
Constructing commodity portfolios requires balancing diversification across categories, managing individual commodity volatility, and aligning with investment timeframe and risk tolerance.
Strategic Allocation Frameworks
Conservative Commodity Portfolio (within 10% commodity allocation):
- 40% Gold (stability, safe-haven, liquidity)
- 25% Broad commodity index (diversified exposure)
- 20% Energy (inflation protection, geopolitical hedge)
- 15% Industrial metals basket (economic exposure)
- 0% Direct agriculture (volatility without compelling returns)
Moderate Commodity Portfolio (within 15% commodity allocation):
- 35% Gold (anchor position)
- 25% Energy (oil, natural gas)
- 20% Industrial metals (copper, aluminum, nickel)
- 10% Precious metals ex-gold (silver, platinum)
- 10% Broad commodity index or agriculture
Aggressive Commodity Portfolio (within 20% commodity allocation):
- 30% Gold (reduced for more cyclical exposure)
- 25% Energy (concentrated positions in crude, natural gas)
- 25% Industrial metals (copper, lithium, cobalt—energy transition focus)
- 10% Silver (leverage to precious metals)
- 10% Agricultural (wheat, corn for supply shock protection)
Supercycle Opportunistic Portfolio:
- 25% Gold (insurance but not primary focus)
- 30% Energy (supercycle beneficiary)
- 30% Industrial metals (supply deficit potential)
- 10% Silver (precious metal leverage)
- 5% Agricultural (tactical)
Diversification Within Categories
Energy diversification:
- 50% Crude oil (global benchmark)
- 30% Natural gas (different supply-demand, less liquid)
- 20% Refined products or energy infrastructure
Industrial metals diversification:
- 40% Copper (primary economic indicator)
- 30% Aluminum (construction, packaging)
- 20% Nickel/Lithium (battery materials)
- 10% Zinc/Other (specialized applications)
Agricultural diversification:
- 35% Grains (wheat, corn)
- 35% Soft commodities (coffee, sugar, cotton)
- 30% Oilseeds (soybeans)
Avoid excessive concentration in single commodities given extreme volatility and potential for extended bear markets in any category.
Rebalancing Considerations
Commodities’ high volatility necessitates disciplined rebalancing:
Annual rebalancing: Review allocations yearly, selling outperformers back to targets and buying underperformers. This forces “buy low, sell high” discipline.
Threshold rebalancing: Act when allocations drift 25%+ from targets (e.g., 10% target becoming 12.5% or 7.5%). More responsive than annual but avoids excessive trading.
Tactical rebalancing: Adjust based on supercycle phase assessment, overweighting early-cycle commodities and underweighting late-cycle categories.
Tax-aware rebalancing: Conduct rebalancing within tax-advantaged accounts when possible to avoid capital gains taxes on profitable rotations.
ETFs and Commodity Indices for Implementation
Individual investors rarely access commodity markets directly, instead using ETFs and index products offering convenient exposure with varying characteristics and trade-offs.
Physical-Backed Commodity ETFs
GLD (SPDR Gold Shares) / IAU (iShares Gold Trust): Hold physical gold bullion in vaults, providing direct gold exposure with minimal tracking error. Expense ratios 0.40% and 0.25% respectively. Trade like stocks with instant liquidity.
SLV (iShares Silver Trust): Physical silver ETF holding 500+ million ounces. Expense ratio 0.50%. Tracks silver spot prices closely though occasional premium/discount to NAV during extreme volatility.
USO (United States Oil Fund): Oil futures-based ETF (no physical oil held due to storage impracticality). Suffers from contango drag reducing long-term returns versus spot prices. Suitable for short-term tactical positions only.
PSLV (Sprott Physical Silver Trust): Alternative to SLV offering allocated silver storage and redemption rights for large holders. Premium to NAV common given structure advantages.
Advantages: Direct commodity exposure, transparent holdings, high liquidity Disadvantages: Storage costs (physical), contango drag (futures), no income generation
Broad Commodity Index ETFs
DBC (Invesco DB Commodity Index): Tracks DBIQ Optimum Yield Diversified Commodity Index with exposure across energy (55%), agriculture (27%), industrial metals (11%), precious metals (7%). Expense ratio 0.87%.
PDBC (Invesco Optimum Yield Diversified): Similar to DBC with active roll optimization attempting to minimize contango costs. Expense ratio 0.59%. Better long-term performance than passive rolling.
GSG (iShares S&P GSCI Commodity-Indexed Trust): Tracks S&P GSCI index heavily weighted toward energy (55%+). More concentrated than DBC. Expense ratio 0.75%.
RJI (Rogers International Commodity Index): More balanced across categories with 44% agriculture, 33% energy, 23% metals. Greater agricultural exposure suits investors seeking food/water crisis protection.
Advantages: Instant diversification, professional management, single-ticker simplicity Disadvantages: Contango drag, rebalancing costs, less precise category control, higher fees
Sector-Specific Commodity ETFs
Energy:
- USO: Crude oil futures (short-term tactical only)
- UNG: Natural gas futures (extremely volatile, contango problems)
- XLE: Energy company stocks (indirect commodity exposure through equities)
Industrial Metals:
- CPER: Copper futures tracking
- JJU: Aluminum futures
- LIT: Lithium & battery metals (mining stock approach)
Agriculture:
- WEAT: Wheat futures
- CORN: Corn futures
- DBA: Agriculture broad basket
- NIB: Cocoa futures
Precious Metals:
- GLD/IAU: Gold
- SLV/PSLV: Silver
- PPLT: Platinum
- PALL: Palladium
Advantages: Targeted exposure to specific commodity views, tactical positioning Disadvantages: Higher concentration risk, greater volatility, contango issues for futures-based
Commodity Producer Equity ETFs
GDX (VanEck Gold Miners ETF): Gold mining companies providing leveraged gold exposure plus dividends. Amplifies gold moves 2-3x but adds company-specific risks.
PICK (iShares MSCI Global Metals & Mining): Diversified industrial metal miners including copper, iron ore, steel producers. Equity market correlation reduces pure commodity exposure.
XLE (Energy Select Sector SPDR): Large-cap oil & gas companies. Dividend income but correlation with broad equities weakens commodity diversification benefits.
Advantages: Dividend income, operational leverage amplifying commodity price moves Disadvantages: Company-specific risks, higher correlation with equities, management quality variance
Index Selection Considerations
Energy-heavy vs balanced: S&P GSCI heavily weights energy (55%+), suitable if bullish on oil. Balanced indices distribute more evenly across categories.
Roll optimization: “Optimum yield” strategies actively select futures contract maturities minimizing contango costs. Over long periods, this adds 1-2% annually versus passive rolling.
Expense ratios: Range from 0.25% (physical gold ETFs) to 1.0%+ (actively managed commodity funds). Consider costs versus tracking quality and features.
Liquidity: Stick to ETFs with $100M+ assets and significant daily volume ensuring tight bid-ask spreads and easy entry/exit.
Conclusion: Integrating Commodities and Gold
Commodities and gold serve complementary roles within diversified portfolios, with each category providing distinct return drivers, risk characteristics, and economic cycle exposures. Understanding these differences enables constructing resilient commodity allocations capturing opportunities across varying environments.
Gold excels as portfolio anchor providing stability, safe-haven protection during crises, monetary inflation hedge, and negative correlation with financial assets. Its role centers on wealth preservation and crisis insurance rather than aggressive returns.
Industrial commodities offer cyclical exposure to global growth, leverage to economic expansions, and participation in secular trends like energy transition. They deliver higher returns during favorable phases but introduce greater volatility and correlation with equities.
Energy commodities provide inflation protection, geopolitical hedge, and supply shock insurance. Oil and natural gas correlate moderately with gold during inflation but diverge during other regimes.
Agricultural commodities offer supply shock protection, food inflation hedge, and diversification from financial assets, though long-term returns prove modest and volatility exceeds reward for passive holders.
The optimal approach combines gold’s stability (30-40% of commodity allocation) with diversified exposure across industrial metals, energy, and selective agricultural positions. This balanced framework captures commodity supercycle participation while maintaining gold’s protective qualities.
Current environment featuring inflation concerns, geopolitical tensions, energy transition demands, and potential early supercycle stages suggests commodity allocations deserve serious consideration. Within 10-20% total portfolio commodity allocations, balanced approaches weighting gold at 35-40%, energy at 25-30%, industrial metals at 20-25%, and other commodities at 10-15% provide reasonable starting frameworks.
Implementation through combination of physical gold (core holdings), broad commodity index ETFs (diversified exposure), and selective sector ETFs (tactical positions) offers practical execution for most investors. Avoid excessive concentration, maintain rebalancing discipline, and align allocations with investment horizon and supercycle phase assessment.
The coming decade may witness commodity performance rivaling the 2000s supercycle or disappointing stagnation resembling the 2010s. By building diversified positions across gold and commodity categories, investors position for opportunities while protecting against scenarios where specific categories underperform. This balanced approach embodies proper diversification’s essence—not predicting the future but preparing for multiple potential outcomes.